Intuitive guide to clustering using kmeans
Contents
Do you need to group together similar data points into sets?
I recently had to do this at work (customer segmentation), and learned that clustering algorithms are perfect for these types of problems.
In this post, I wrote about why you would want to use a clustering algorithm, and an intuitive explanation of how it works.
If you need to solve this sort of problem, what are some possible solutions?
- manually determine the appropriate clusters
- use kmeans
Manually
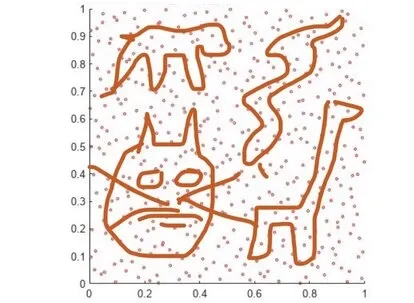
How would you do this manually? Basically, you graph out your data on a chart. If you have two dimensions/features to use, then you can use a dimensionality reduction method to reduce the dimensions so you can plot it out.
Next you determine, either visually or using numerical thresholds, which data points meaningfully belong to which set. Hopefully not in the shapes of this chart below. 😅
 When is this a good approach?
- only have a few dimensions
- data doesn’t change much
- don’t need to do this often
If your data doesn’t meet the above criteria (eg. your data features change often), then you may find it painful to do this manually on a regular basis.
kmeans
kmeans is an unsupervised machine learning algorithm that does the clustering for you. No need to painstakingly and manually plot out different groups.
There are many other clustering algorithms (eg. HDBSCAN), that work better for certain datasets than others. Once you have your raw data transformed into a manner suitable for use with kmeans, you can easily experiment with the other clustering algorithms to see which ones are suitable for your data.
scikit-learn is my go to library for this because of their great documentation, and the variety of clustering methods available. We’ll look at kmeans first because it’s relatively simple to use, and very fast. This post will go over how the algorithm works intuitively, and not the code.
Step 1: Assign each point to its closest centroid
Let’s say we have a simple dataset below, and we’re trying to cluster the data into 2 groups/clusters (red and blue).
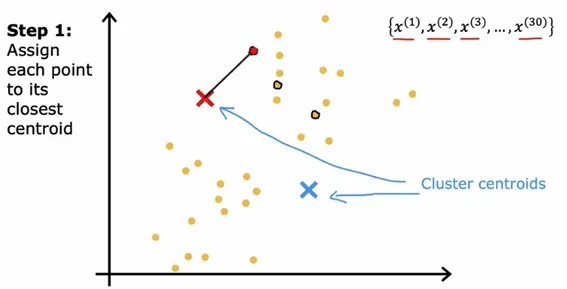
The algorithm just randomly guesses at 2 points that might be the centers of each cluster. This first guess is very bad, but we need to start somewhere. After, it looks at each individual data point, and sees which cluster center it’s closest to.
Step 2: Recalculate the centers
Now we have the first set of clusters. It’s not a very good guess yet. How do we improve this?
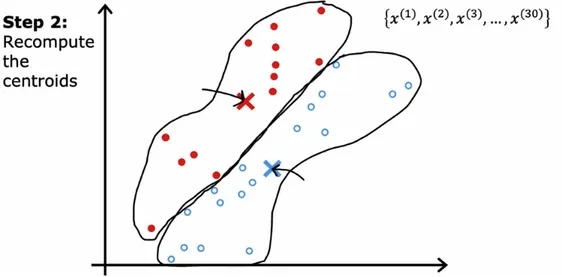
For each cluster, we find it’s average point which becomes the new center. Next, each individual data point is recalculated to see which new cluster center it’s closest to.
Step 3: Repeat
The first 2 steps are repeated continuously, until a stopping condition is met.
For the scikit-learn library, stopping conditions are:
- convergence (center points don’t change)
- relative difference of cluster centers is less than a specified threshold
- maximum number of iterations
Choosing k
kmeans requires us to choose, in advance, the number of clusters we want. How do we decide this?
Think about your project requirements. How will you use this data? For example, if you are segmenting restaurants, it might make sense to make 5 clusters, so you can assign each restaurant a value from 1 star to 5 stars.
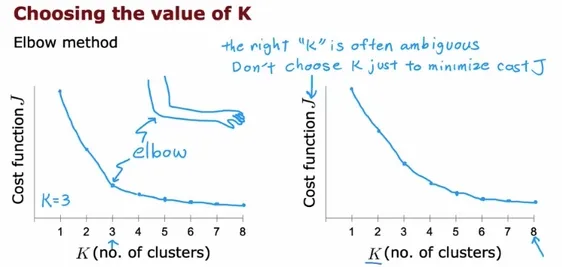
If you don’t have these project requirements, one approach is to use the elbow method. The elbow method helps you choose k by running the kmeans algorithm several times with different values of k, while recording the cost function for each run.
What is a cost function?
Intuitively, the cost function is, for each cluster, how far the data points are from their cluster center. So the farther the data points are from their cluster center, the worse the clustering. This means you want a lower cost function, so that the data points are as close as possible to their cluster center.
After you’ve run your experiments, you can plot the cross function against k to see where the ‘elbow’ is.
 [^1]
[^1]
The elbow is the point where further decreases in the cost function become minimal. The reasoning is that choosing greater k values requires more computation without that much benefit.
Conclusion and further reading
kmeans (and other clustering algorithms) are very handy to use when you need to quickly group together similar data points into sets. If you’d like to read further about which clustering algorithm is a better fit for your dataset, the scikit-learn clustering docs are a great starting point.
Resources
- Images from Andrew Ng’s kmeans lecture.
Have some thoughts on this post? Reply with an email.